
School Performance Data
Pirbright Academic Outcomes
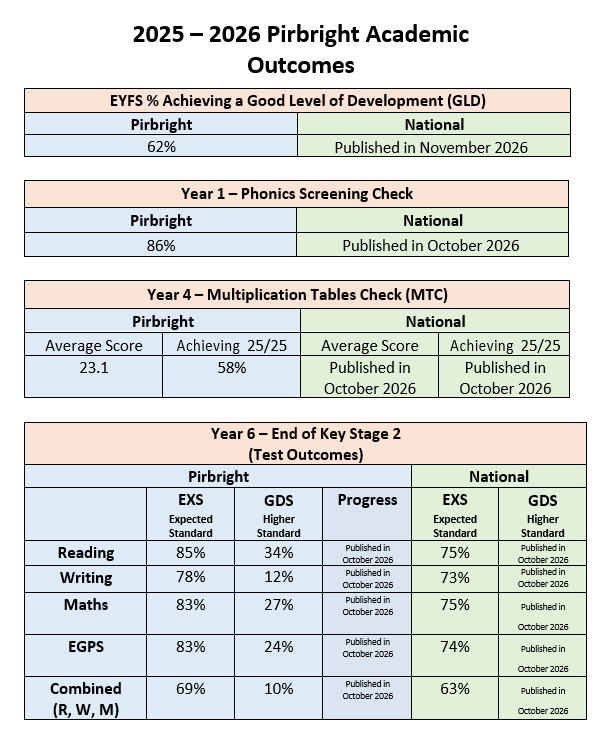
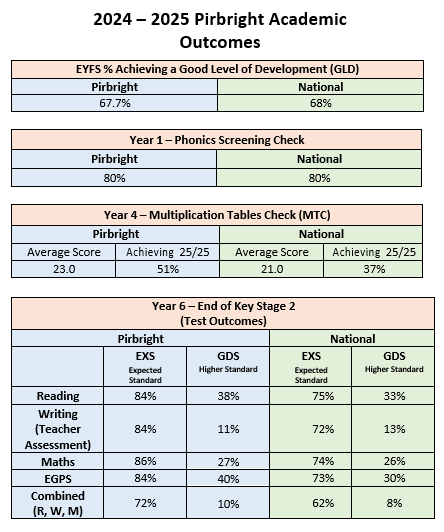
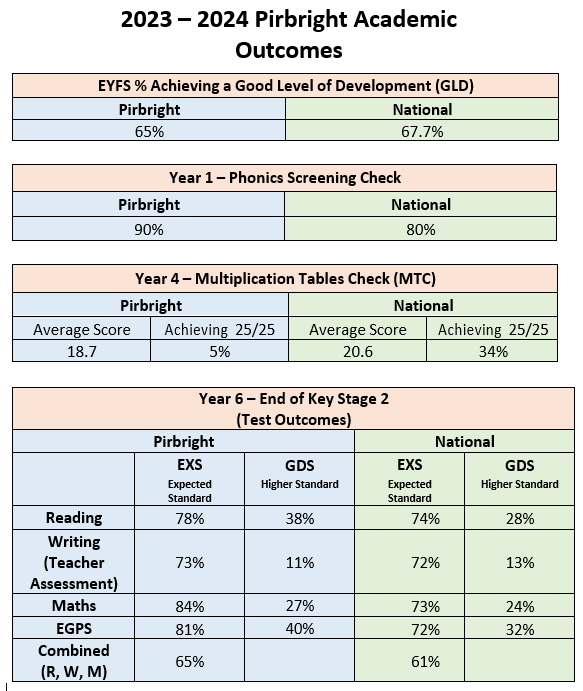
The tables below show our pupils' outcomes over the last three academic years. These national assessments provide information about children's attainment and progress at different stages of their primary education.
- Early Years Foundation Stage (EYFS) – Good Level of Development (GLD): The percentage of children who achieve the expected level of development by the end of Reception, showing they are well-prepared for Year 1.
- Year 1 Phonics Screening Check: The percentage of pupils who meet the expected standard for decoding and reading words using phonics.
- Year 4 Multiplication Tables Check (MTC): Assesses pupils' fluency in recalling multiplication facts up to 12 × 12.
- Year 6 SATs: National assessments in Reading, Mathematics and Grammar, Punctuation and Spelling, alongside teacher assessment of Writing. Results show the percentage of pupils achieving the expected and higher standards.
- Key Stage 2 Progress Measures: These show the progress pupils make between their starting points and the end of Year 6 in Reading, Writing and Mathematics, compared with pupils nationally who had similar prior attainment. A score of 0 represents average progress, while positive scores indicate above-average progress and negative scores indicate below-average progress.
These measures provide useful information about academic outcomes, but they represent only one aspect of school life. We are equally committed to developing happy, confident and well-rounded learners who are ready for the next stage of their education.
- School Performance Data Pirbright Results on the DfE Website
- School Comparison Tool The Department for Education (DfE) has recently released a new service on .gov.uk which will replace their existing Performance Tables. It can be used to compare performance data across schools and to check individual schools.